I wanted to know two things about the NZ COVID counts, which are released by the government at
Here’s the result of my data analysis as of April 9.
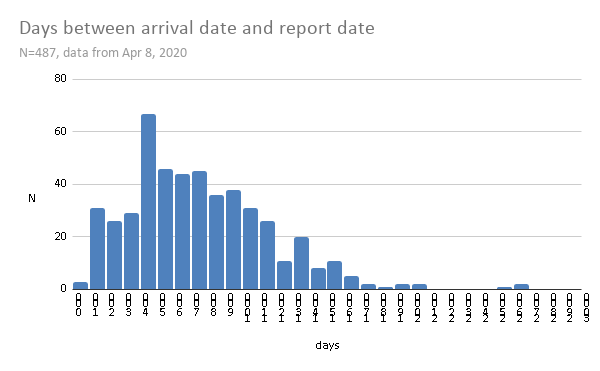
- How many cases had a big delay between return-to-NZ date and report date? (about 5%; up to three weeks)
To calculate this, I just added a calculation to the Google sheet:
A2-MAX(I2, H2)
and did standard analyses on the numbers. I manually fixed cases where the date reported was before the date arrived; in those cases it looks like the month was incorrectly entered.
| stat | # |
|---|---|
| count | 487 |
| mean | 7.04 |
| median | 6 |
| mode | 4 |
| max | 26 |
| stdev | 4.2 |
| days > 14 | 26 |
| % days > 14 | 5.34% |
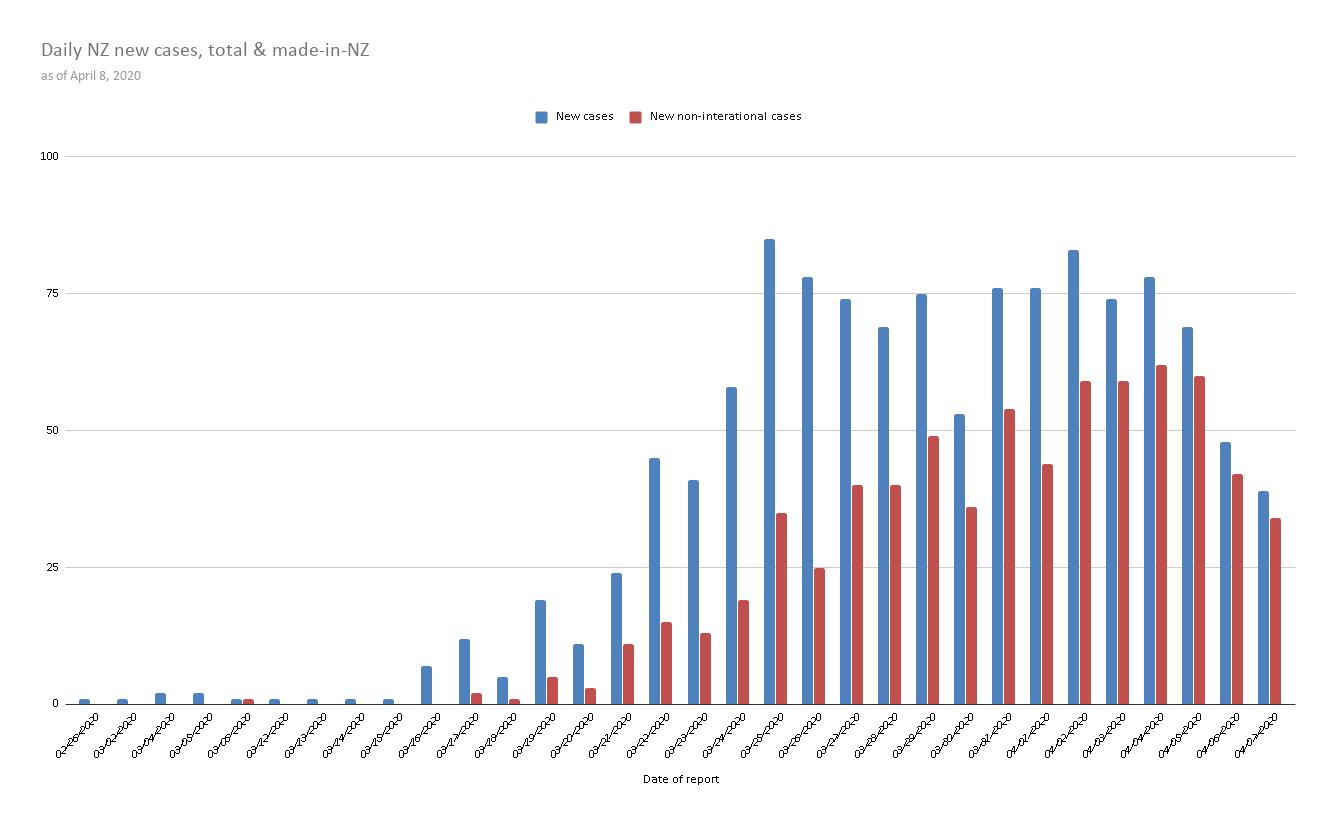
- Is the drop in new cases only due to the border being closed, or are we seeing drops in transmission too? (Non-international growth rate is about 5% in the past few days, so we are both importing fewer cases and transmitting fewer cases.)
The government used to report international vs close contacts vs community transmission, but now it only reports international-or-not. But that’s still enough data to figure out how many cases per day are not international.
The spreadsheet also includes percentages. The Python code perday.py calculates all of this given a .csv that merges the confirmed and probable sheets of the government spreadsheet. Spreadsheet:
https://docs.google.com/spreadsheets/d/1PVFcO0du5zNqrKoxmA9SzzfKSKrewUZw/edit#gid=319944801
The % new non-international cases has never been above 12% since March 12, and is near 5% now.
Code available at
https://github.com/patricklam/nz-covid-data-munging