I believe that collecting data is the first step in assessing the health of a referee community. In the context of Judo Ontario, it would be especially useful to know how long it might take before we once again have a corps of National referees.
Data source: I have data from 19 seasons between 2001 and 2024, based on information from the referee rosters that were distributed annually to Quebec referees. This includes names and referee grades. I also have limited information on birth years and regions.
Context: Judo Québec has had around 10,000 members for the past 25 years. I have the impression that membership may have been up to 2k higher at some point, but the number for 2024 is 9,773.
Some of the scripts used to process the data are on GitHub. Some of the data analysis was done in a spreadsheet which I’m not making publicly available.
Demographics
Q: What is the size of the referee roster every year, and how much of it is senior (National A and up) versus junior (National B and below)? What is the percentage of women?
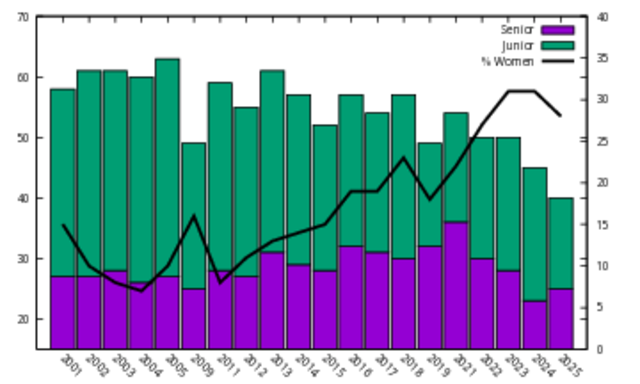
The total number of active referees in Quebec has varied between 40 (2024-2025) and 63 (2004-2005). Until 2027-2018, the number was generally above 57 with two outliers. Starting in 2018-2019, the number dropped to 49, bounced back to 54, and then dropped to 50 and then 40. The past two years have seen a decrease of 5 in each year.
Given the numbers above, one would expect that the number of senior referees (National A and above) is more stable year-to-year. It is indeed roughly the same in 2024-2025 as it was in 2000-2001 (25 versus 27). The maximum is 36 (in 2019-2020, an abnormally high proportion of a total count of 54) and the minimum is 23. The year-by-year variation in the number of senior referees is between +4 (which occurs 3 times) and -5 (which occurs once; -1 and -2 are much more common).
There is more variability in the number of junior referees, which also varies between 36 (in 2004-2005) and 15 (in 2024-2025). The number of referees that left in 2018-2019 was the highest, at -10, and second-highest in 2024-25, at -7. The highest increase is 4 in 2017-2018.
There have been significant efforts, especially led by Diane Couture, to increase the proportion of women in refereeing. Quebec’s Escouade Feminine d’Arbitrage is now working on this. We can see a steady increase in the percentage of women on the roster.
In the long term, there needs to be a balance between the number of referees entering the roster and the number leaving the roster. (Technically, there is also the question of how many referees are needed to staff the competition circuit, but let’s take that to be constant.)
Q: How many referees join the roster every year? How many referees leave the roster? At what level do they join and leave?
The above question counted totals, but that does not measure the churn. I also investigated how many individual referees joined and left per year.
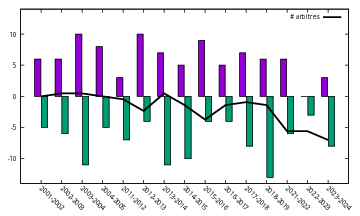
The number of new referees on the roster varies from +10 (in 2013 and 2004) to 0 (2023); it was +3 in 2012 and 2024. There are quite a few years with double-digit losses: 2004, 2014, 2015, and 2019. Despite 2024 being the smallest roster to-date, the number of losses was only -8, so it looks more like this number was not balanced by new referees.
The average number of referees leaving per year is 7, so that needs to be balanced by recruiting 7 new referees per year. The average number of new referees per year is 6, so we can see the long-term downward trend resulting from this imbalance.
Q: What is the average age at which referees leave the roster?
Note that referees leave the roster either because they retire or they move away from Québec. This data is quite sparse for lower-ranked referees, as I just don’t have this historical data.
| Final grade | age | # |
|---|---|---|
| IJF | 66 | 7 |
| Continental | 52 | 3 |
| Nat A | 46 | 7 |
| Nat B | 39 | 3 |
| Nat C | 37 | 10 |
| Prov A | 32 | 2 |
| Prov B | 24 | 5 |
Q: What is the current age distribution of referees?
For the 2024-2025 season, the average age of Prov B to Nat B referees is 41; Prov B is 39; Nat A referees is 46; and for Continental it is 52. This is unfortunately a large increase in average age compared to 2023-2024, when the average age of Prov B referees was 29, the average age of Prov B to Nat B was 34, Nat A was 47, and Continental was 51.
Q: What regions are referees from?
I have data for 85 referees.
| Region | # |
|---|---|
| Bas St-Laurent/Gaspésie | 7 |
| Capitale Nationale/Québec | 6 |
| Centre-du-Québec/Estrie 6 | |
| Lanaudière | 5 |
| Laurentides | 1 |
| Laval | 1 |
| Mauricie | 6 |
| Montéregie | 1 |
| Montreal | 18 |
| Outaouais | 3 |
| Rive-Sud | 22 |
| Saguenay/Lac St-Jean | 7 |
Referee Grades, Retention, and Promotion
Referee grades are one indicator of the effectiveness of referee education. It is critical to have a corps of senior referees who can mentor less experienced referees and take on positions of responsibility at tournaments (chief referee, mat chief). At the same time, having a top-heavy corps can be a sign of a lack of recruiting, and may indicate that there will be problems as existing referees retire.
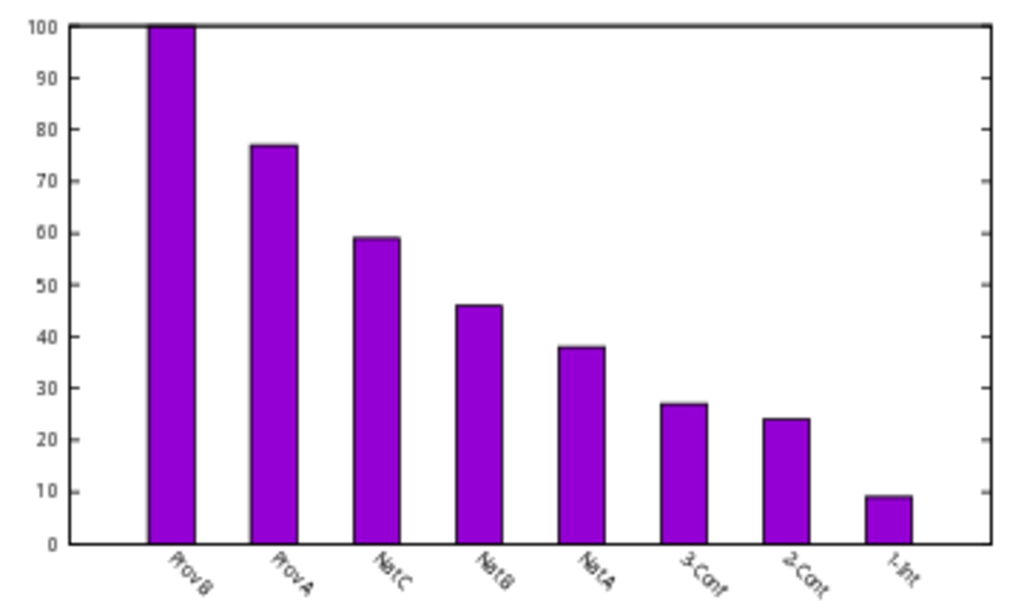
Of all referees who have been on the Quebec roster,
- 8% attain a grade of International
- 22% attain a grade of Continental or International
- 38% attain a grade of National A or higher;
- 60% attain a grade of National C or higher;
- 40% have a highest grade of Provincial A.
The vast majority of referees join at either Prov B (69%) or Prov A (21%), making 90% of the total. Referees left at Prov B (25%) or Prov A (20%) or Nat A (11%).
Because 38% of referees reach National A, we would need to recruit about 2.6 Provincial B referees to get 1 National A referee (in 7 years’ time), and about 4.5 referees to get 1 Continental referee.
At each grade, every year, what is the probability that a referee continues (C), leaves the roster (NC)), or is promoted (P)?
| Grade | C T | C M | C F | NC T | NC M | NC F | P T | P M | P F |
|---|---|---|---|---|---|---|---|---|---|
| Prov B | 71% | 73% | 67% | 29% | 27% | 33% | 34% | 37% | 27% |
| Prov A | 86% | 90% | 69% | 14% | 10% | 31% | 24% | 22% | 34% |
| Nat C | 85% | 84% | 89% | 15% | 16% | 11% | 25% | 22% | 42% |
| Nat B | 94% | 93% | 100% | 6% | 7% | 0% | 30% | 27% | 44% |
| Nat A | 93% | 92% | 95% | 7% | 8% | 5% | 13% | 11% | 23% |
| Conf | 96% | 95% | 100% | 4% | 5% | 0% | 19% | 17% | 50% |
| Cont | 90% | 90% | 89% | 10% | 10% | 11% | 6% | 6% | 0% |
| IJF | 90% | 91% | 82% | 10% | 9% | 18% |
For any given year, a Provincial B referee has a 71% chance of remaining on the roster for the next year, including a 34% chance of promotion, and a 29% chance of not continuing. Given those stats, the expected lifetime of a Provincial B referee is 3.4 years, or 2.9 years until promotion.
This number varies a bit for women. The probability, each year, of continuing next year (either as Prov B or higher) for Prov B women is 67%, and for men 73%. The annual probability of being promoted is 27% for women and 37% for men, which means that we would expect women to stay at Prov B for an extra year before being promoted.
Provincial A and National C have about an 85% probability of continuing and a 24% probability of promotion (expected 7 years on roster, 4 years until promotion).
By gender, we also see a large gap in Provincial A womens’ annual probability of continuing, at 69%, versus 90% for men. However, the annual probability of promotion out of all grades from Provincial A to National A is significantly higher (10%-20%) for women than for men.
Female referees at Provincial A and B are less likely to continue than male referees. They are also less likely to be promoted out of Provincial B. However, once women reach Provincial A, they have a higher annual chance of being promoted than men.
National B and up have a 90% chance of continuing, slightly higher for women than for men. For National A, expected number of future years on roster = 14, probability of promotion 13% yearly.
Q: What is the average time for a referee to progress from Provincial B to National A?
Over the reference period, at least 29 referees have progressed from Prov B (12) or Prov A (17) and the average time from first appearance to National A is 7.44 years. This is consistent over time. The fastest is 3 years and the slowest is 13 years.
What is the average time for a referee to progress from National A to Continental?
This data is not quite clean because of the old Confederal grade, but for the 23 referees in the data set, the range is between 2 years and 18 years, with a mean of 6.7 years.